Grouping rows in Excel lets you collapse detail rows under a heading or total, so a long sheet turns into a tidy summary you can expand when needed. It’s built into Excel for Microsoft 365 on Windows, Mac, and the web. This guide covers grouping manually, using keyboard shortcuts, building groups automatically with Auto Outline and Subtotal, creating nested levels, and removing groups.
Quick Answer
Select the rows you want to group (for example, rows 2 to 4), go to the Data tab, and click Group in the Outline section. Or press Shift + Alt + Right Arrow. Click the minus (−) button in the left margin to collapse the group and plus (+) to expand it.
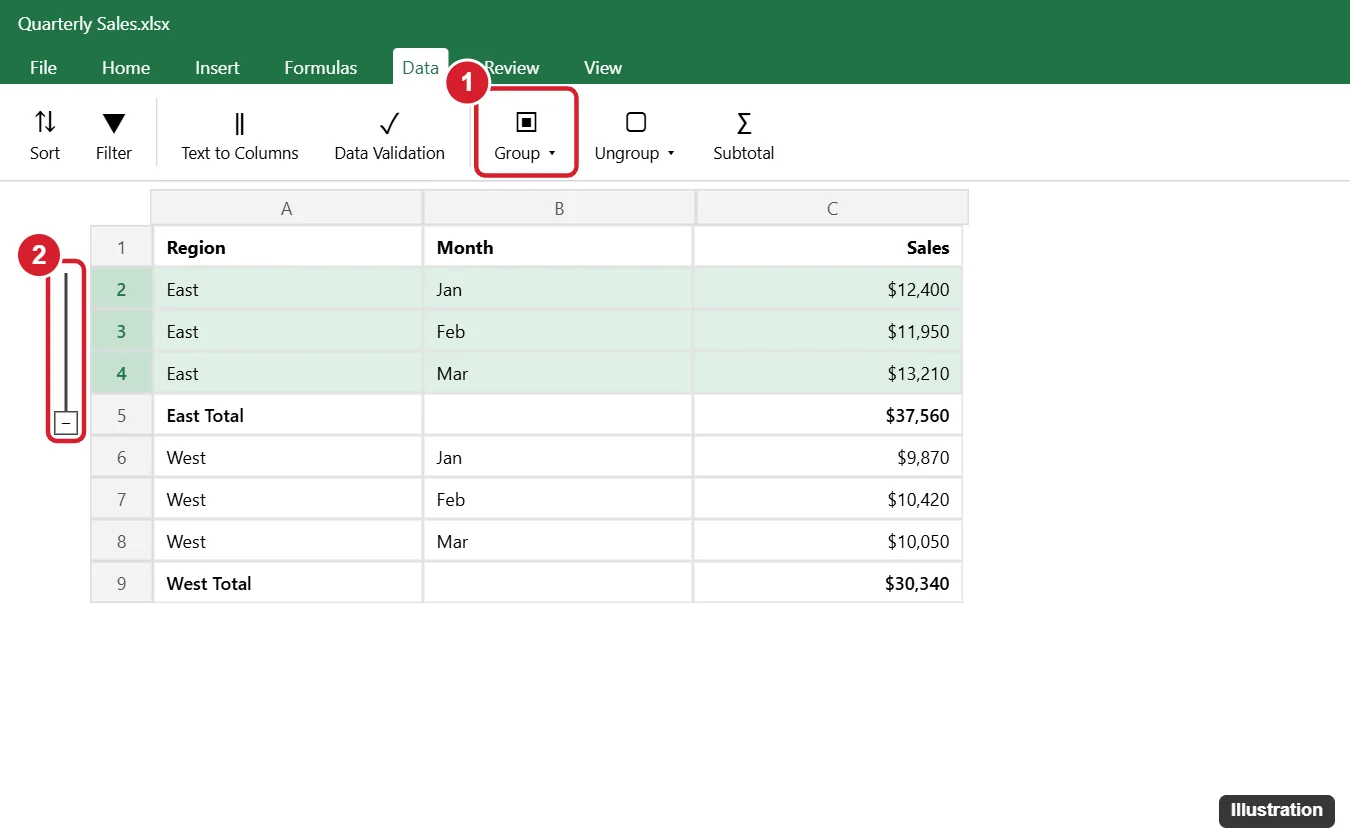
Group Rows Manually
- Select the detail rows by clicking and dragging over their row numbers. Don’t include the summary row (such as a total) you want to keep visible.
- Go to Data > Outline > Group. If you selected cells rather than whole rows, choose Rows in the dialog and click OK.
- A bracket and a − button appear to the left of the row numbers. Click − to collapse and + to expand.
- Repeat for each section you want to group.
Keyboard Shortcuts
| Action | Windows | Mac |
|---|---|---|
| Group selected rows | Shift + Alt + Right Arrow | Cmd + Shift + K |
| Ungroup selected rows | Shift + Alt + Left Arrow | Cmd + Shift + J |
| Show or hide outline symbols | Ctrl + 8 | Ctrl + 8 |
Create Nested Groups (Multiple Levels)
You can group up to eight levels deep. Group the larger block first (for example, an entire quarter), then select smaller blocks inside it (each month) and group again. Numbered buttons (1, 2, 3…) appear above the outline bar. Click 1 to show only the top-level summary, or the highest number to show every row.
Group Rows Automatically
Auto Outline
If your data has summary rows with formulas such as =SUM(C2:C4) directly below or above the detail rows, click any cell in the data, then choose Data > Group > Auto Outline. Excel builds the groups from your formulas.
Subtotal
- Sort your data by the column you want to group by (for example, Region).
- Select the data and click Data > Subtotal.
- Choose At each change in (Region), the function (Sum), and the column to total (Sales). Click OK.
Excel inserts subtotal rows and groups each section. To undo it, open Subtotal again and click Remove All.
Ungroup or Clear Groups
- Ungroup one section: select its rows and click Data > Ungroup (or Shift + Alt + Left Arrow).
- Remove all groups: click Data > Ungroup > Clear Outline. Collapsed rows stay hidden, so select the rows around them and choose Home > Format > Hide & Unhide > Unhide Rows if needed.
Put the Summary Row Above the Details
By default, Excel assumes totals sit below their detail rows, so the +/− button appears at the bottom of each group. If your headings are above the details, click the small dialog launcher arrow in the corner of the Outline group and uncheck Summary rows below detail.
Group Rows in Excel for the Web
Excel for the web supports grouping too: select the rows, then choose Data > Group > Group. Collapse and expand work the same way, though some options like Auto Outline may be limited.
Troubleshooting
- Group button is grayed out: the sheet may be protected, you may be editing a cell (press Esc), or your data may be formatted as a Table. Convert it with Table Design > Convert to Range first.
- Outline symbols disappeared: press Ctrl + 8, or check File > Options > Advanced > Show outline symbols if an outline is applied.
- Two groups merged into one: adjacent groups combine. Leave a summary row or blank row between sections.
- Auto Outline says it can’t create an outline: your summary rows need formulas that reference the detail rows.
Frequently Asked Questions
What’s the difference between grouping and hiding rows?
Hiding removes rows from view with no visual cue beyond the missing row numbers. Grouping adds clear +/− controls so anyone can expand and collapse sections with one click.
Can I group columns the same way?
Yes. Select columns instead of rows and use Data > Group; the controls appear above the column letters.
Does grouping affect formulas or printing?
Formulas still include collapsed rows. When printing, only the rows currently expanded are printed.
Summary
- Select the detail rows.
- Click Data > Group or press Shift + Alt + Right Arrow.
- Use − and + or the level numbers to collapse and expand.
- Use Ungroup or Clear Outline to remove groups.

Kermit Matthews is a freelance writer based in Philadelphia, Pennsylvania with more than a decade of experience writing technology guides. He has a Bachelor’s and Master’s degree in Computer Science and has spent much of his professional career in IT management.
He specializes in writing content about iPhones, Android devices, Microsoft Office, and many other popular applications and devices.