Windows 11 doesn’t have a built-in CPU temperature readout. Task Manager shows your GPU temperature on many systems, but not the processor’s. To see CPU temperature you can check the BIOS/UEFI, or use a free monitoring app that reads the sensors on the processor and motherboard. This guide covers each method, what the readings mean, and what counts as too hot. Everything here also works on Windows 10.
Quick Answer
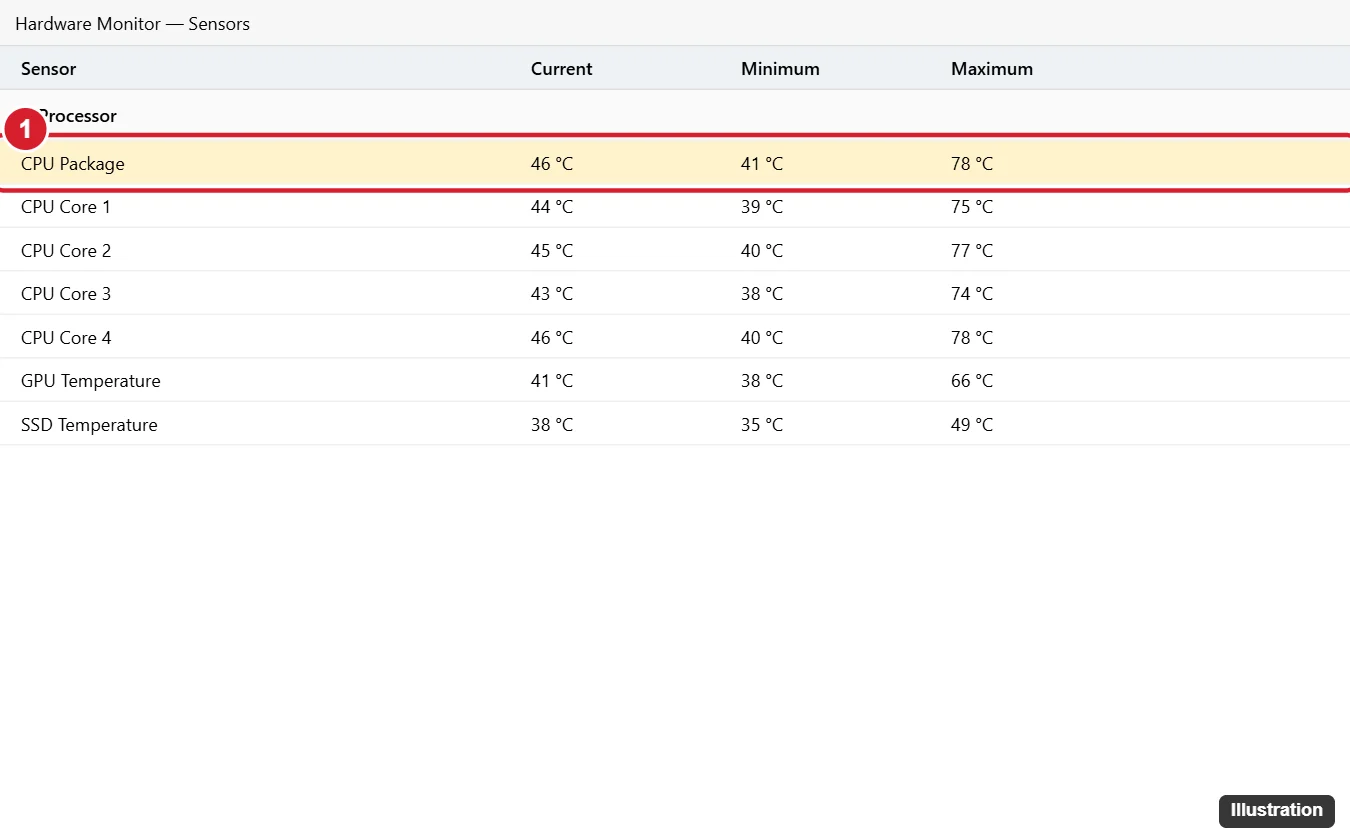
Install a free hardware monitoring tool such as HWiNFO, Core Temp, HWMonitor, or the open-source LibreHardwareMonitor, open it, and look for CPU Package (Intel) or CPU (Tctl/Tdie) (AMD). That number is the overall processor temperature. Individual core readings appear below it.
Method 1: Use a Free Monitoring App (Most Accurate)
- Download one of the tools below from the developer’s official website. Avoid download mirrors that bundle extra software.
- Install or extract it and run it. Some tools ask for administrator permission because they read hardware sensors directly; click Yes.
- Find the temperature section for your processor:
- Intel: look for CPU Package and Core #0, Core #1, and so on.
- AMD Ryzen: look for CPU (Tctl/Tdie) or Tctl, plus CCD readings on multi-chiplet chips.
- Note the Current, Minimum, and Maximum columns. Run a game or heavy task for a few minutes, then check the maximum.
| Tool | Good for | Notes |
|---|---|---|
| HWiNFO | Detailed sensor data, logging | Choose Sensors-only at launch. Can show values in the system tray. |
| Core Temp | Simple, lightweight CPU-only readout | Shows per-core temperatures and can display them in the taskbar tray. Watch for optional bundled offers in the installer. |
| HWMonitor | Quick overview of CPU, GPU, drives, fans | Portable version available (no install). |
| LibreHardwareMonitor | Open-source option | Portable; run as administrator for full sensor access. |
| Manufacturer utilities | Laptops and prebuilt PCs | Many laptop and motherboard makers include a control center app that shows CPU temperature and fan speed. |
Method 2: Check the BIOS/UEFI
Every modern motherboard shows CPU temperature in its firmware settings. It’s handy when you can’t install software, but the reading is taken while the PC is sitting idle in the firmware, so it won’t show temperatures under load.
- Open Settings > System > Recovery.
- Next to Advanced startup, click Restart now.
- Choose Troubleshoot > Advanced options > UEFI Firmware Settings > Restart.
- Look on the main screen or under a section named Hardware Monitor, PC Health Status, H/W Monitor, or Monitor.
You can also press the firmware key during startup (commonly Del, F2, F10, or F12, depending on the manufacturer).
Method 3: PowerShell (Limited)
You may see guides recommending this command in an administrator PowerShell window:
Get-CimInstance -Namespace root/wmi -ClassName MSAcpi_ThermalZoneTemperatureIt returns CurrentTemperature in tenths of a kelvin (divide by 10, then subtract 273.15 for Celsius). In practice this is an ACPI thermal zone, not the CPU sensor. On many PCs the command fails with “Not supported”, or it returns a value that never changes. Treat it as a rough indicator at best and use a monitoring app for real readings.
What About Task Manager?
Open Task Manager (Ctrl + Shift + Esc), go to Performance, and click GPU. On PCs with a supported dedicated graphics card and a current driver, you’ll see GPU temperature. The CPU page shows usage and speed, but no temperature.
What Is a Normal CPU Temperature?
Exact limits depend on the processor model, so check your chip’s specifications for its maximum. As a general guide:
| Situation | Typical range |
|---|---|
| Idle / light use (desktop) | About 30–50°C |
| Idle / light use (thin laptop) | About 40–60°C |
| Gaming or heavy work | About 60–85°C |
| Sustained 90°C or more | Worth investigating, though some recent high-end chips are designed to run up to their limit (often in the 95–105°C range) under full load |
When a CPU reaches its maximum, it protects itself by lowering its speed (thermal throttling). If it keeps overheating, the PC may shut down. Short spikes when opening an app are normal; what matters is the sustained temperature under load.
How to Lower a High CPU Temperature
- Clean out dust from fans, vents, and heatsinks with compressed air (hold fans still while you blow).
- Improve airflow: keep laptops on hard surfaces and leave space around desktop vents.
- Check fans are spinning; monitoring apps show fan RPM.
- Check for runaway processes in Task Manager that keep the CPU busy at idle.
- Choose a balanced power mode in Settings > System > Power & battery.
- Replace thermal paste on older desktops, or have a technician do it for laptops.
- Update the BIOS/UEFI and chipset drivers from your PC or motherboard maker, which can include fan and power fixes.
Frequently Asked Questions
Why does Windows 11 not show CPU temperature?
Temperature sensors differ between processor families and motherboards, and Windows doesn’t include a general CPU temperature display. Monitoring apps include support for specific chips and boards.
Which reading should I use: package or core?
Use CPU Package (Intel) or Tctl/Tdie (AMD) as the headline number. Core readings help spot one hot core, but the package value is the best single figure.
Why do my readings differ between apps?
Apps may read different sensors or update at different intervals. Small differences are normal. Large differences usually mean one app doesn’t fully support your hardware; update it.
Can I show CPU temperature on the taskbar?
Yes. HWiNFO and Core Temp can place live temperature icons in the system tray.
Summary
- Windows 11 has no built-in CPU temperature display; Task Manager shows GPU temperature only.
- Use a free monitoring app and read CPU Package or Tctl/Tdie.
- Use the BIOS/UEFI for a quick idle reading without installing anything.
- Around 30–50°C at idle and 60–85°C under load is typical; investigate sustained readings near your chip’s maximum.

Kermit Matthews is a freelance writer based in Philadelphia, Pennsylvania with more than a decade of experience writing technology guides. He has a Bachelor’s and Master’s degree in Computer Science and has spent much of his professional career in IT management.
He specializes in writing content about iPhones, Android devices, Microsoft Office, and many other popular applications and devices.